


Organization charts are an important tool for conveying often complex systems in an accurate and compelling way. This example illustrates an arts and culture organization and how their mission statement is at the center of their efforts, surrounded by 3 levels of operation that are distinct yet working in concert to realize their intended [...]

FFA – New Century Farmer Infographic
csnider2026-03-19T03:59:14+00:00Translated program data and participant insights into a clear, visually engaging narrative that communicates the mission and measurable impact of the New Century Farmer program.
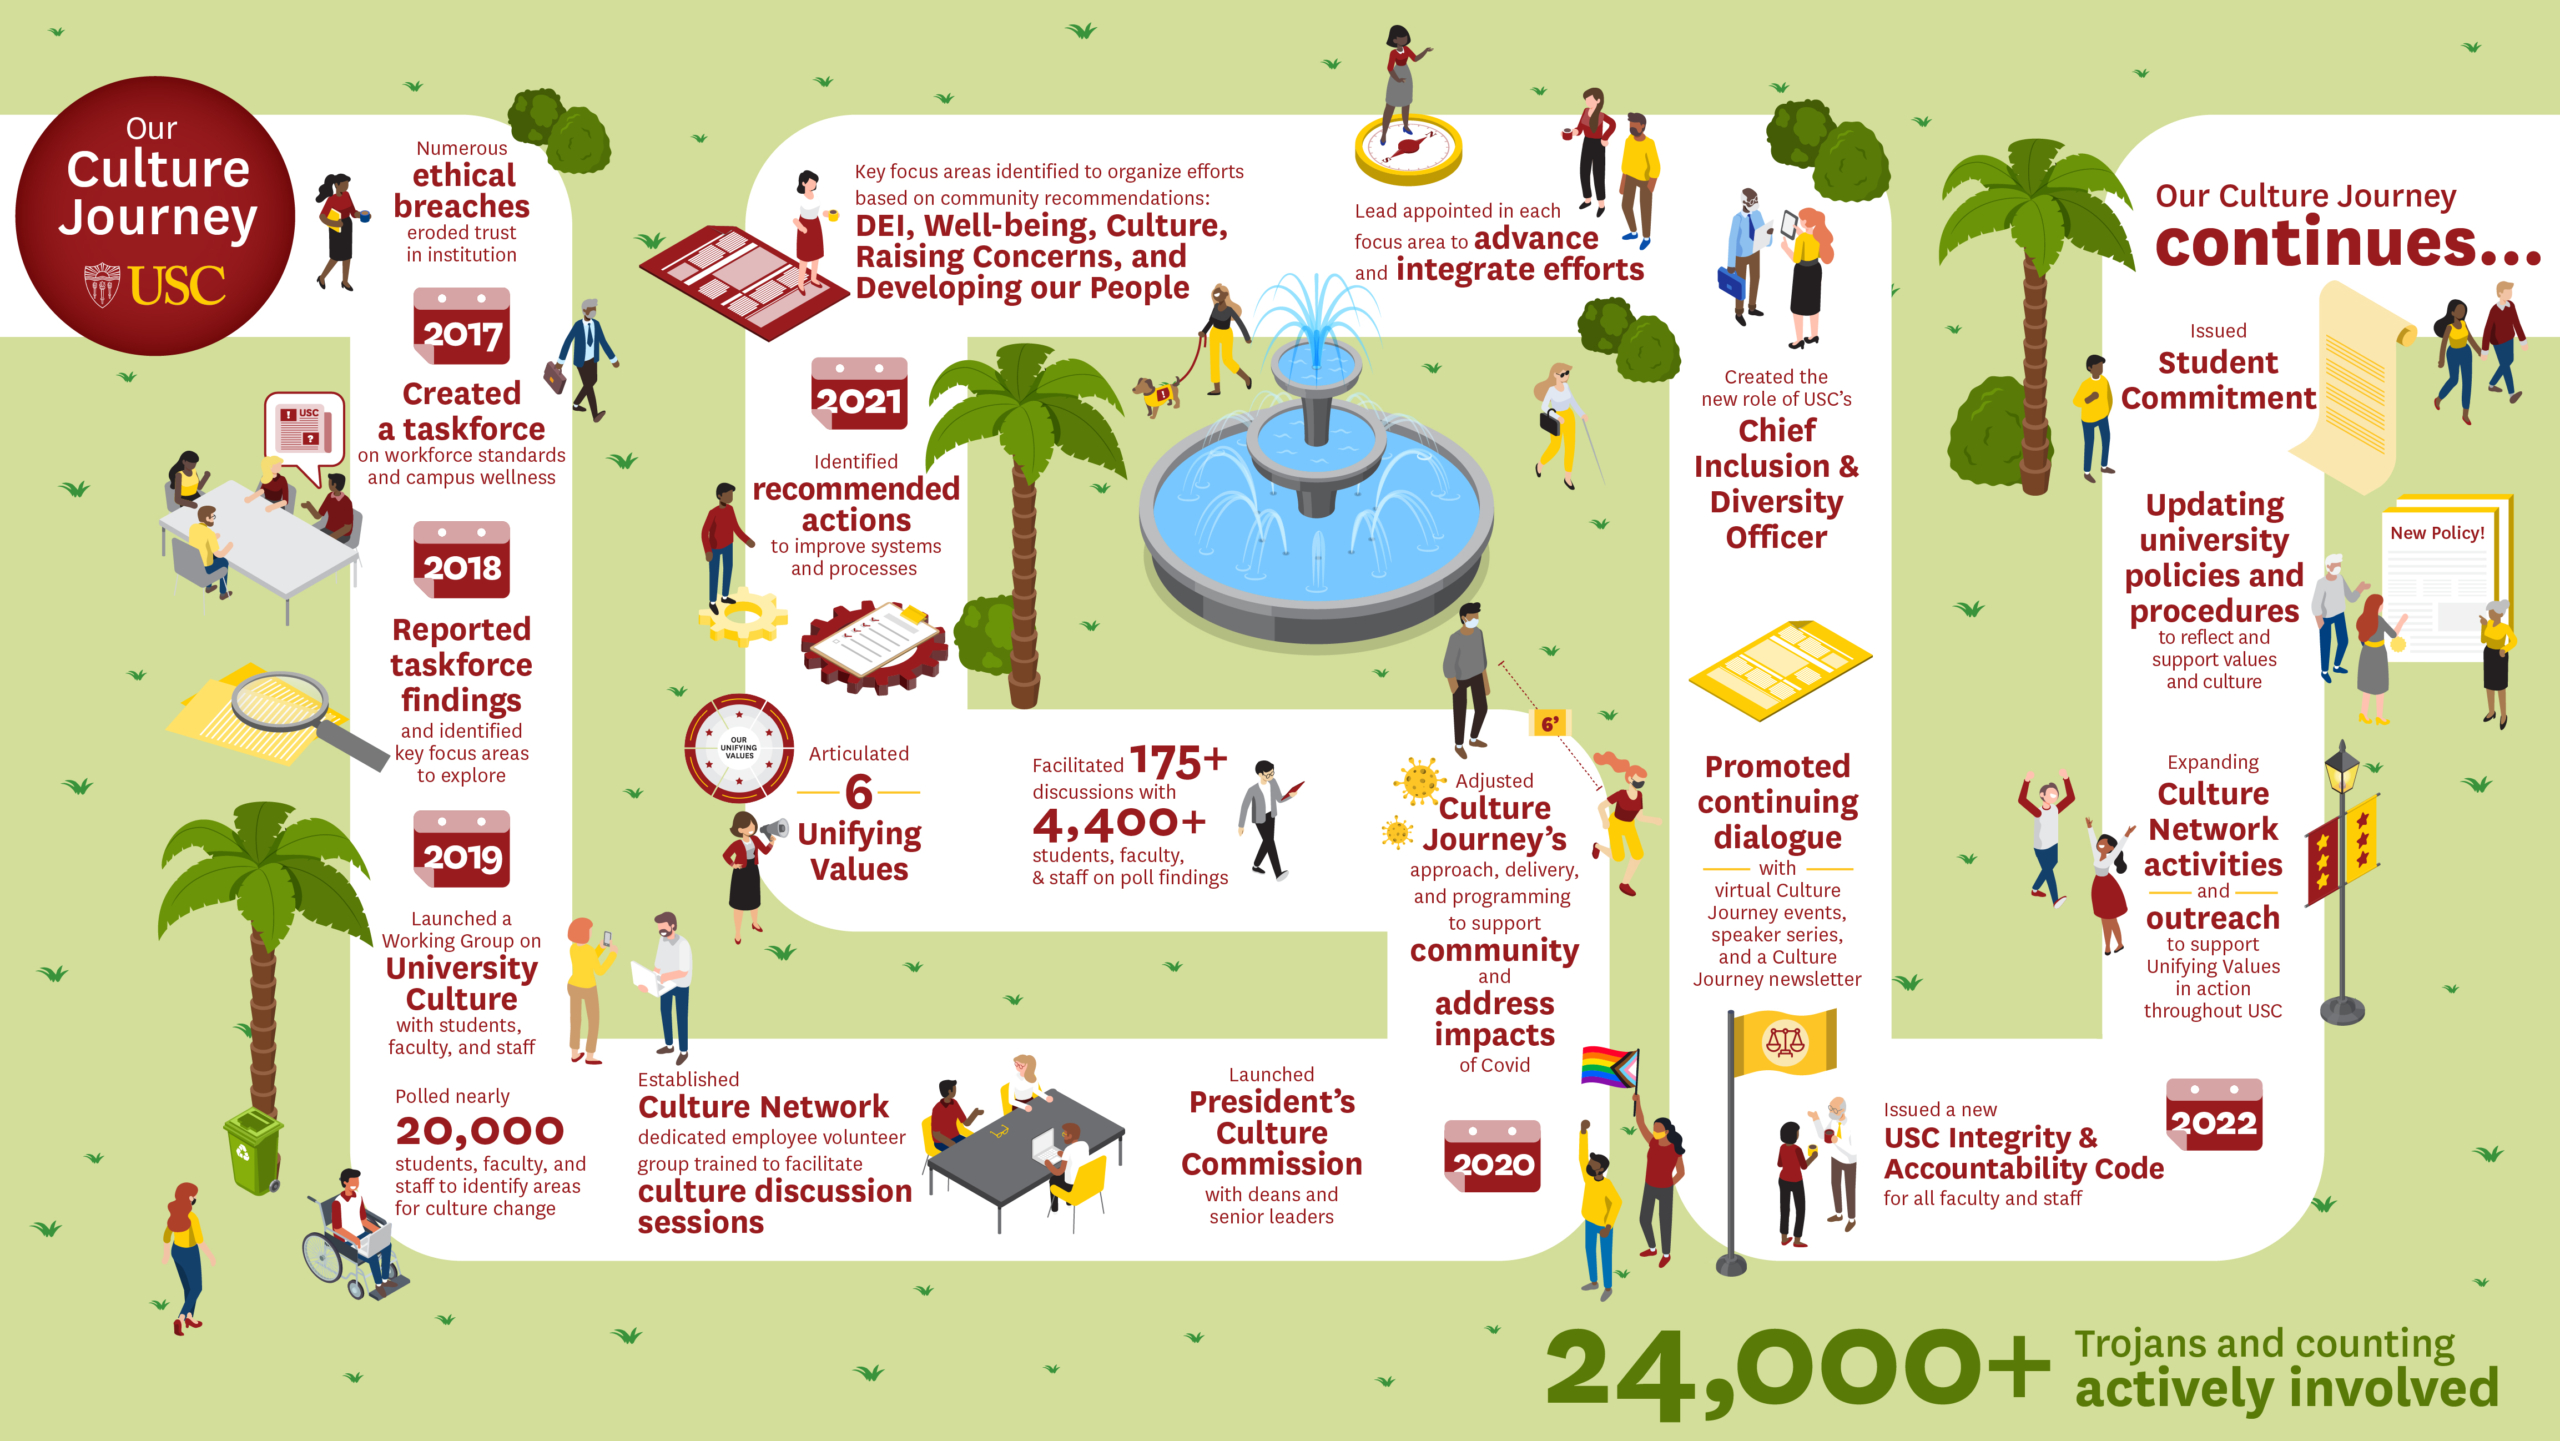
University of Southern California – Culture Journey Map
csnider2026-03-17T04:40:07+00:00As part of our efforts at Blue Beyond to support the development and design of USC's comprehensive Culture Report, I helped develop visual communication assets to tell the story of that journey. One such asset is the Culture Journey Map. This infographic is centered in a modern, isometric approach while never losing sight of [...]